Media grid
Key Features
Data Analysis
Data Analysis
The Data Analysis module enables interpretation of the data generated within VisionInfo platform. This includes analysing engagement and device behaviour to gain insights into content performance and audience preferences. This analysis helps inform content strategy and decision-making to enhance user experience.
Remote Monitoring and Control
Remote Monitoring and Control
Remote monitoring within VisionInfo allows users to track and monitor the status, settings and health of any display within an installation. This includes monitoring key metrics such as uptime, content delivery, user activity and security.
Content Publishing
Content Publishing
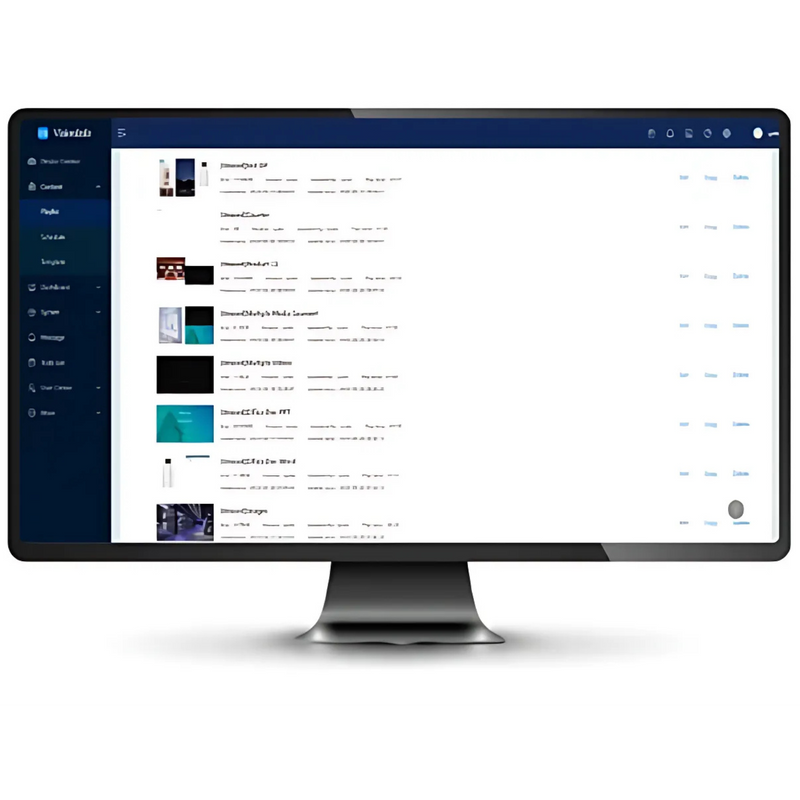
VisionInfo makes it effortless to create, edit and organise digital content within our CMS platform. Users have full control making content available to the intended audience through a simplified publishing process.
Error Notifications
Error Notifications
Error notifications are a vital element within any remote system allowing users to be notified instantly when an error or issue occurs within the CMS environment.
Drag-and-Drop Visual Editor
Drag-and-Drop Visual Editor
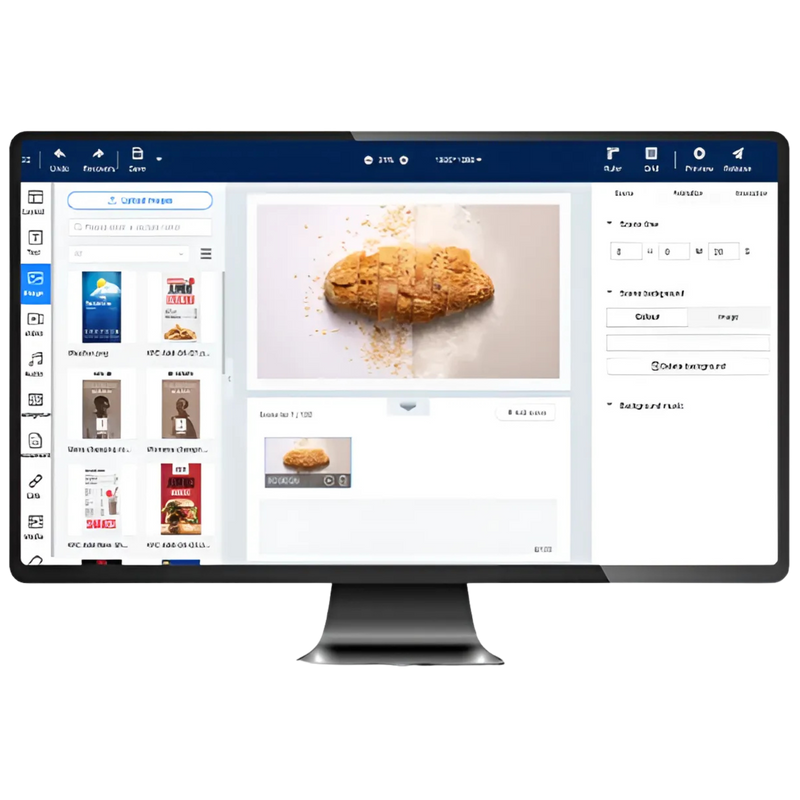
Utilise the drag-and-drop feature within the VisionInfo platform to view and organise widgets, videos, images, webpages, weather reports and clocks. Users can then easily drag and drop input media and sources into the layout.
Routine Automation
Routine Automation
Routine automation within VisionInfo allows users to create automated processes within the software to streamline repetitive tasks and workflows. It involves interative tools to automate content publishing, updating applications and display maintenance. This dramatically improves efficiency and ensures consistent quality across the CMS environment.
Content Creation
Content Creation
Utilise the powerful features within the VisionInfo platform to create, publish, and manage digital content, empowering users to produce and distribute engaging materials for their audience.
Visual Reporting
Visual Reporting
VisionInfo presents data and analytics in a visual format, such as charts, graphs, and interactive dashboards. It enables users to easily understand and interpret complex data sets related to content performance, audience metrics, engagement levels, and other key indicators.


